Scale Sustainable Agriculture
Publishing research and creating open source tools to quantify sustainable agriculture’s economic and environmental benefits
The Latest
- DSE developed an open source tool that helps quantify sustainable agriculture’s benefits to crop insurance stakeholders, so that agents can in turn incentivize farmers to implement these practices.
- The tool depicts climate impacts on corn crop yield and yield stability over the next 30 years, and recommends federal policy opportunities to incentivize sustainable agriculture practices.
- We published our findings in the Journal of Data Science, Statistics, and Visualisation and were featured in 11 news stories, including in the Hill and Grist.
Background on U.S. Crop Insurance
Federal crop insurance is primarily administered by the United States Department of Agriculture (USDA) and is a critical safeguard to our country’s food system. Generally, all US farmers receive insurance coverage through this program, although some farmers may also have supplemental insurance from private companies. Currently the primary metric for determining federal coverage (as defined by the Farm Bill) is a grower’s annual average crop yield.
Our Impact
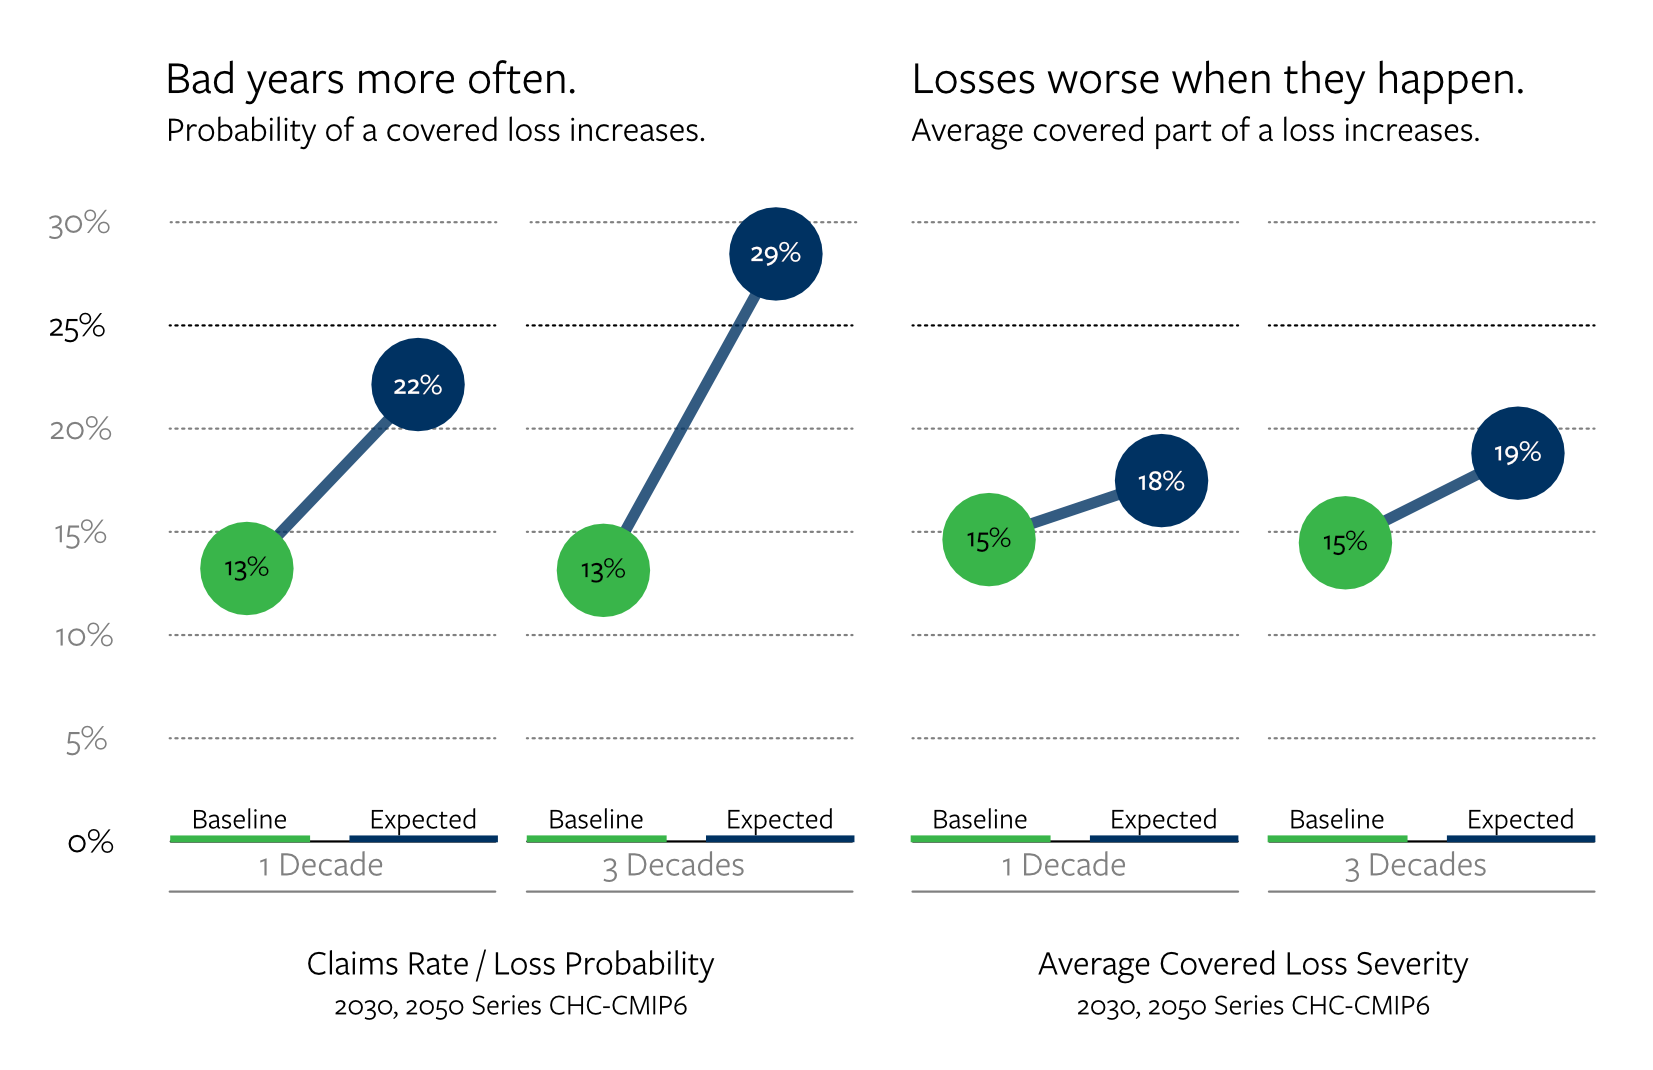
In partnership with the Berkeley Food Institute and the University of Arkansas, DSE built an open source tool to help quantify climate impacts on corn crop yield and yield stability for insurance agents. Using artificial intelligence, we projected corn yields over the next three decades under static growing conditions. We compared those with scenarios predicted by the Intergovernmental Panel on Climate Change, which anticipate more extreme weather in this time frame, in order to assess impacts on crop yields and insurance.
Key Findings
- Without action, crop insurance companies could see a doubling of insurance claim rates by 2050.
- Taxpayers heavily subsidize the insurance program, which means that taxpayers will be responsible for most of the increased cost.
- There is a need for strategic adjustments to crop insurance programs given the likelihoods of different (worsening) climate scenarios, and policy opportunities that may increase financial security for farmers and insurance companies into the future.
Recommendations
Farmers could receive greater financial incentive to adopt more sustainable practices, companies could see a lower overall claims rate, and we save taxpayer dollars by doing the following:
- A relatively minor change to text in the Farm Bill could incentivize farmers to adopt (or better account for farmers who have already adopted) sustainable agricultural practices like cover cropping and crop rotation. While these practices can result in a lower average yield from one year to another, farmers are rapidly adopting them to increase crop resilience over time.
- A similar change could be made via 508(h), a mechanism for private companies to recommend alternative and/or supplemental insurance products for USDA’s consideration.
Explore the tool! You only need a web browser; no software is required for download.
- Learn how crop insurance prices are set by clicking on “rates.”
- See how changes to those structures would play out for high- and low-stability growers by clicking on “claims.”
- The “neighborhoods” tab shows where these changes are most likely to have impacts.
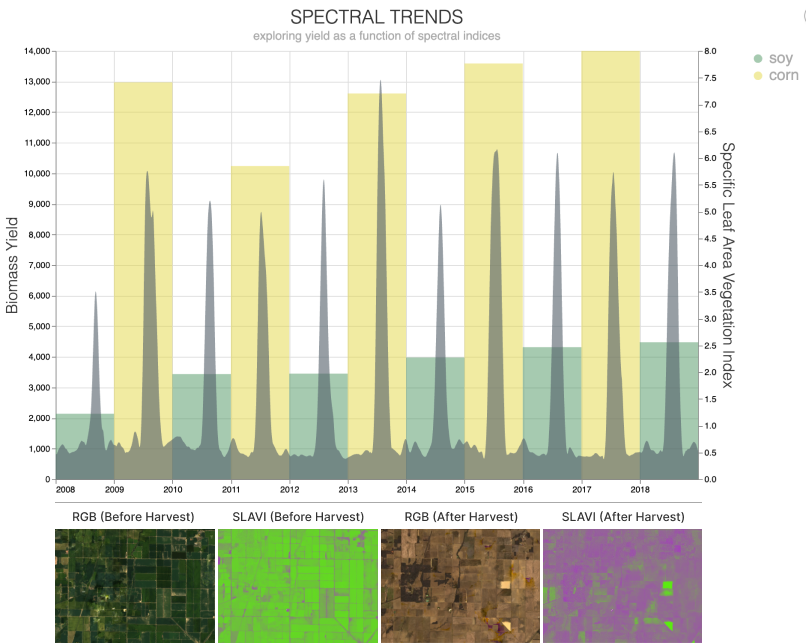
Spectral Indices Database
Schmidt DSE maintains a public database that tracks over 14,000 points in corn and soy fields across the midwestern US. This effort is complementary to our crop yield stability work. Recently Schmidt DSE created statewide and county-level maps that track continuous living cover, or instances where farmers are alternating between agricultural growing seasons and cover cropping, to supplement related research. This project will help track agricultural land use decisions and how they do (or do not) promote beneficial services such as soil carbon sequestration, protection of water quality, soil fertility, and habitat for soil biodiversity.
We are releasing an open-source codebase so that researchers can quickly generate new databases for their own locations and metrics of interest (project description available here).
Future Vision
We are continuing to explore opportunities for federal change in the long term. This includes leading an economic study that will help quantify the financial savings for USDA if the government were to implement our policy recommendations. In parallel, we are engaging with the American Farmlands Trust, which is working to synthesize and better understand the availability of cover cropping data. We look forward to advancing our collaboration with the University of Arkansas as it conducts experiments on the agroeconomical implications of decisionmaking under climate change.